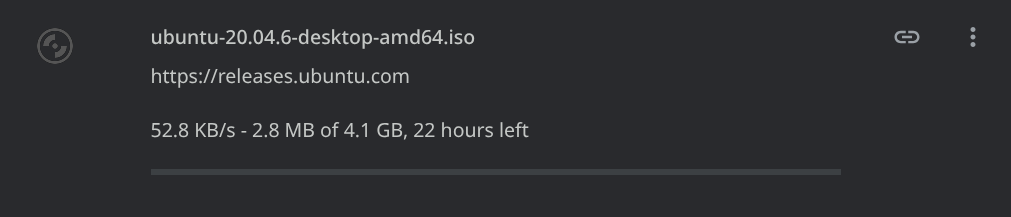
Ethernet connection are not usable at all the speed of download anything being 56 KB/s my internet speed is 1666 KB/s and it working good on Wifi but on Ethernet it’s like no connection at all
I tried on live ubuntu iso and it worked fine so the cable and the card are fine
I don’t know what to provide please help
First thing to check is that there is not a duplex/speed mismatch. You can use ethtool for that…
/usr/sbin/ethtool <interface name>
Please post output as pre-formatted text (refer to the </> button in the forum editor).
BTW, when you mention download speed, that can be due to the server loading. Can you do a speed test for comparison as well? (There are many online to choose from).
If you’re up to it technicality, you can also use iperf between two hosts on the same network to do throughput testing etc.
Thanks for the respond
basel@ELMSHTSHT:~> /usr/sbin/ethtool eno2
Settings for eno2:
        Supported ports: [ TP ]
        Supported link modes:   10baseT/Half 10baseT/Full
                                100baseT/Half 100baseT/Full
                                1000baseT/Full
        Supported pause frame use: Symmetric Receive-only
        Supports auto-negotiation: Yes
        Supported FEC modes: Not reported
        Advertised link modes:  10baseT/Half 10baseT/Full
                                100baseT/Half 100baseT/Full
                                1000baseT/Full
        Advertised pause frame use: Symmetric Receive-only
        Advertised auto-negotiation: Yes
        Advertised FEC modes: Not reported
        Link partner advertised link modes:  10baseT/Half 10baseT/Full
                                             100baseT/Half 100baseT/Full
                                             1000baseT/Full
        Link partner advertised pause frame use: No
        Link partner advertised auto-negotiation: Yes
        Link partner advertised FEC modes: Not reported
        Speed: 1000Mb/s
        Duplex: Full
        Auto-negotiation: on
        Port: Twisted Pair
        PHYAD: 1
        Transceiver: internal
        MDI-X: off (auto)
netlink error: Operation not permitted
        Current message level: 0x00000007 (7)
                               drv probe link
        Link detected: yes
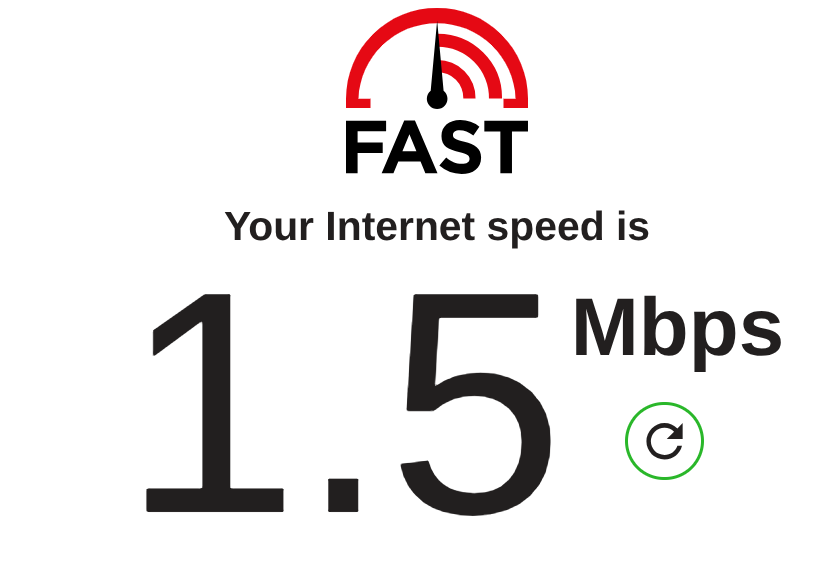
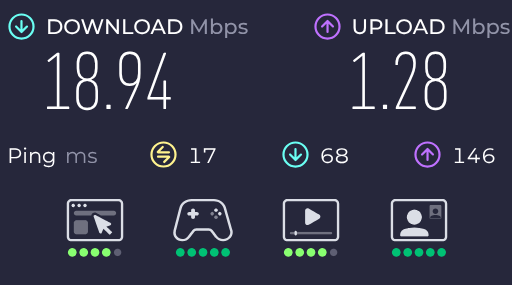
and for this on Ethernet I cannot open speedtest.net at all so I tried fast.com
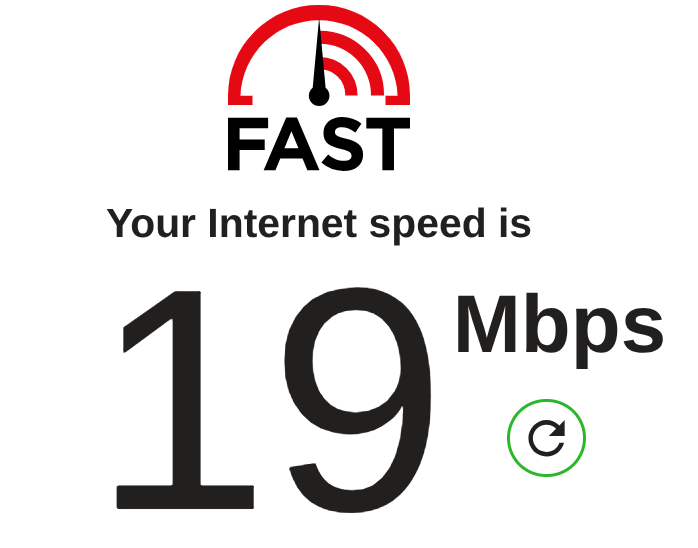
for wifi

for cable
Ok, the next thing to try
sudo ethtool -K eno2 tso off gso off gro off
Then run the speed test again.
This turns off some “offload” features in the network card that can sometimes cause severe slowdowns. Just something to rule out from the investigation.
I’m not sure what is going on here…it could be a driver-related issue I guess.
What does sudo ethtool --show-eee eno2 return? Depending on the chipset, it may just report netlink error: Operation not supported (as with the NIC I am using). Some Intel chipsets provide “Energy Efficient Ethernet” - just something to check.
Also, check PCI power management perhaps. What is returned by the following command?
cat /sys/bus/pci/devices/0000:00:1f.6/power/control
Is it on or auto?
If you are willing to install the very small program “mtr” then I find it useful to spot where slow downs occur. Once installed send the command in a bash shell
sudo mtr google.com
It won’t solve the problem … but it may point where you are encountering a slow down. However it won’t point out if there is a dns (domain name server) issue. For that you could try the program ‘dig’ which likely you need to install.
Once installed send:
dig google.com
Errors at the start could point to DNS issues.
My apologies - I have no solutions. I am just trying to help you find the location of the slow speed issue.
Further to this, you could send the command:
sudo mtr -r -c 10 google.com | tee mtr_report.txt
It will take about a minute (possibly a bit more) to run. In the end it will display the output on the bash shell and store in the file : “mtr_report.txt”.
SAMPLE GOOD OUTPUT:
HOST: lenovo                      Loss%   Snt   Last   Avg  Best  Wrst StDev
 1.|-- XiaoQiang                  0.0%    10    1.8   2.0   1.3   3.3   0.7
 2.|-- 10.0.1.64                  0.0%    10    3.1   2.5   1.8   3.1   0.4
 3.|-- node-b29.pool-182-53.dyna  0.0%    10   14.3  14.3  13.3  16.1   0.9
 4.|-- 100.127.0.101              0.0%    10   15.1  15.4  13.0  18.8   2.1
 5.|-- ???                       100.0    10    0.0   0.0   0.0   0.0   0.0
 6.|-- node-16zp.pool-125-24.dyn  0.0%    10   21.7  22.1  21.4  24.1   0.9
12.|-- pnbkkj-ag-in-f14.1e100.ne  0.0%    10   21.9  22.9  21.4  26.0   1.3
In the above, XiaoQiang is the home router. node-b29.pool-182-53.dyna is the ISP.
WHAT TO LOOK FOR:
GOOD SIGNS:
- Loss% = 0.0% (or very low)
- Avg latency gradually increases: 2ms → 14ms → 22ms
- StDev (standard deviation) values are low (under 2.0)
- Best/Worst times are close together
PROBLEM SIGNS:
- High packet loss (>5%): Network congestion
- Sudden latency spikes: 15ms → 185ms = problem at that hop
- High StDev (>10): Inconsistent/unstable connection
- Multiple ??? in a row: Network outage
COLUMNS EXPLAINED:
- Loss% = Packet loss percentage (most important)
- Avg = Average response time (most important)
- Best/Wrst = Fastest/slowest response
- StDev = Consistency (low = good)
PROBLEM EXAMPLE:
 3.|-- isp-router.com             0.0%    10   15.2  14.8  18.7  15.1
 4.|-- broken-node.com           25.0%    10  185.4 185.1 180.2 195.8  ← PROBLEM HERE
 5.|-- next-router.com           22.0%    10  195.8 195.2 185.1 205.2  ← CONTINUES
= ISP infrastructure problem at hop 4
NETWORK PATH (in the example):
- Hops 1-2: Your local network
- Hops 3-6: Your ISP infrastructure
- Hops 7+: Internet backbone + destination
Single ??? hop = Normal (router blocking ICMP)
Multiple ??? = Actual problem
Use this data when contacting your ISP - gives exact problem location!
Honestly? I do not know if it will help the OP, but I found this useful for myself.
Thinking about this some more … if wifi is good, and ethernet not good, then its likely something not configured correctly in openSUSE tumbleweed.
ie a network adapter driver issue, or a network configuration issue, or a software interference (highly unlikely I think, but credible), or something in your router deliberately slowing down the wired port speeds.
so likely best to ignore my ‘mtr’ suggestions. While interesting, ‘mtr’ is not relevant to the problem, I think. … although you could run it when using wifi ,… and then run again when using wired … but I suspect that will only confirm what you already posted.
After running for some time (incl. a speed test) check the output of “ip stats”, for me that gives:
2: eno1: group link
    RX:  bytes packets errors dropped  missed   mcast
      29624878   22955      0       0       0       0
    TX:  bytes packets errors dropped carrier collsns
       2428468    9336      0       0       0       0
Are for you any of these last four counters non-zero?
Did you check with another cable?
Any other machines on the Ethernet network?
Have you tried live Tumbleweed?
Thanks for all of the responds I’m gonna try it all and show you
for this command it shows me
basel@ELMSHTSHT:~> sudo ethtool --show-eee eno2
[sudo] password for root:
EEE settings for eno2:
enabled - inactive
17 (us)
        Supported EEE link modes:  100baseT/Full
                                   1000baseT/Full
        Advertised EEE link modes:  100baseT/Full
                                    1000baseT/Full
        Link partner advertised EEE link modes:  Not reported
and for
basel@ELMSHTSHT:~> cat /sys/bus/pci/devices/0000:00:1f.6/power/control
on
it says on
Your assistant is helpful actaully but I cannot understand somethings
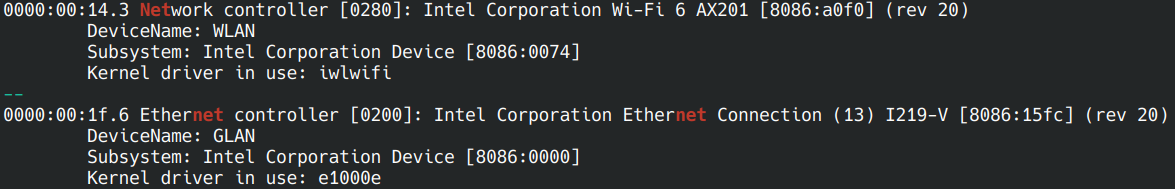
for :
it shows me this
and for
basel@ELMSHTSHT:~> dig google.com

; <<>> DiG 9.20.11 <<>> google.com
;; global options: +cmd
;; Got answer:
;; ->>HEADER<<- opcode: QUERY, status: NOERROR, id: 30640
;; flags: qr rd ra; QUERY: 1, ANSWER: 1, AUTHORITY: 0, ADDITIONAL: 1

;; OPT PSEUDOSECTION:
; EDNS: version: 0, flags:; udp: 512
;; QUESTION SECTION:
;google.com.                    IN      A

;; ANSWER SECTION:
google.com.             133     IN      A       142.250.200.238

;; Query time: 15 msec
;; SERVER: 163.121.128.134#53(163.121.128.134) (UDP)
;; WHEN: Sun Aug 10 15:32:24 EEST 2025
;; MSG SIZE  rcvd: 55
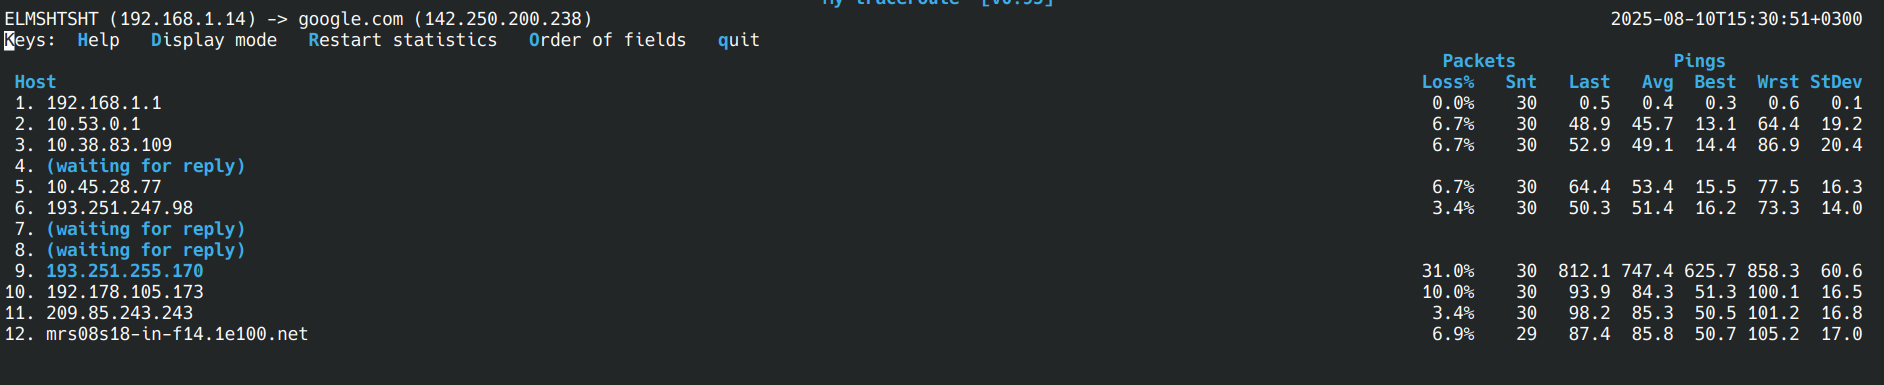
I really cannot decide if that is good or bad but there is a line have a massive numbers for ping
for command
basel@ELMSHTSHT:~> sudo mtr -r -c 10 google.com | tee mtr_report.txt
Start: 2025-08-10T15:22:46+0300
HOST: ELMSHTSHT                   Loss%   Snt   Last   Avg  Best  Wrst StDev
  1.|-- 192.168.1.1                0.0%    10    0.4   0.4   0.3   0.4   0.1
  2.|-- 10.53.0.1                  0.0%    10   39.0  35.3  15.9  45.7  10.2
  3.|-- 10.38.83.109               0.0%    10   36.7  42.0  32.2  58.3   8.8
  4.|-- ???                       100.0    10    0.0   0.0   0.0   0.0   0.0
  5.|-- 10.45.28.77                0.0%    10   34.5  33.6  21.0  75.4  15.8
  6.|-- 193.251.247.98             0.0%    10   16.9  28.3  16.9  45.6  10.0
  7.|-- ???                       100.0    10    0.0   0.0   0.0   0.0   0.0
  8.|-- ???                       100.0    10    0.0   0.0   0.0   0.0   0.0
  9.|-- 193.251.255.170            0.0%    10  486.2 545.8 486.2 670.7  59.7
 10.|-- 192.178.105.173            0.0%    10   74.1  72.2  59.2  80.7   7.5
 11.|-- 209.85.243.243             0.0%    10   79.6  64.6  56.0  79.6   8.8
 12.|-- mrs08s18-in-f14.1e100.net  0.0%    10   73.7  64.2  54.0  73.7   6.3
there is a couple of loss%
I really wanna blame the cable or the port but trying another distro and working just fine not a reasonable thing to blame
Yes I have non-zero numbers
2: eno2: group link
    RX:  bytes packets errors dropped  missed   mcast
       1459443    6008      0       0       0      12
    TX:  bytes packets errors dropped carrier collsns
       1020204    7059      0     109       0       0
I tried different cable yes and different port gave the same issue I tried on an olc pc I have it worked but at low speed too I think the hardware is the problem
also it opened speedtest.net normal on my laptob not opening at all if that’s point to anything
a weird thing everything works good not just work even great???
I didn’t do anything really just your assistant
I don’t know what to say either…
And the bytes/packets counters are still relatively low. mcast can be ignored but dropped is not good.
Check ethtool -S to see which counters are non-zero.
Good you tested with an old PC and could reproduce the problem, that means that is likely the other side, I assume that is some kind of Internet router but some more information is welcome.
Some other ideas … Looking at your tests:
EEE (Energy Efficient Ethernet) - I wonder (speculate really) if this might be related to the problem.
Your EEE output shows:
- EEE is enabled but inactive
- Link partner not reporting EEE support
Now before I go further, let me say this is all pretty much above my head and I am only paraphrasing what I read in searching. I read the EEE being enabled but inactive and Link partner (router/switch): “Not reported" suggests a mismatch.
Again, it is NOT something I am familiar with … but … anyway
I read further, a mismatch might cause intermittent delays as the network interface tries to negotiate power-saving modes with equipment that doesn’t properly support it. The symptoms might be what you’re seeing - periodic high latency spikes.
In that case I read that disabling EEE might help to check (where EEE is Energy Efficient Ethernet), a standard design to reduce power consumption on ethernet connections during periods of low network activity. For EEE, when enabled, both ends of the connection can:
- Enter “sleep” mode during idle periods
- Wake up quickly when data needs to be transmitted
- Save power by reducing unnecessary electrical activity:
I speculate (and speculate IS what I am doing) that maybe your EEE status shows a problematic configuration?
- Your Intel card: EEE enabled, advertising support
- But your Link partner (router/switch): “Not reported” - doesn’t properly advertise EEE support
My speculation here is there is a mismatch where this mismatch can cause:
- Wake-up Delays: Your network card tries to enter sleep mode, but the other end doesn’t coordinate properly, causing delays when traffic resumes.
- Packet Queuing: If your card is “sleeping” when packets arrive, they get queued/buffered, creating the exact latency spikes you’re seeing.
- Negotiation Overhead: Constant failed attempts to coordinate power-saving states can add microsecond delays that accumulate into the millisecond delays you’re experiencing.
I read the above. I do not know if accurate nor if applicable to you.
So to disable EEE:
sudo ethtool --set-eee eno2 eee off
Then test your connection again. The speculation here is that EEE can cause the network card to briefly “sleep” and take time to wake up, creating the kind of latency spikes you’re seeing at hop 9.
If that works, then the next step would be to find a way to make it permanent. … But frankly, this puzzles me. This should ‘just work’ with no need to do this … But I diverge.
After disabling, to put things back, you can reboot if you wish to renable EEE.
I suggest disabling it with sudo ethtool --set-eee eno2 eee off
See if that makes a difference with the speed testing. It can be made permanent if it has a positive impact.